A height keeps increasing. Can its rate of change still decrease?
During the first three seconds, a ball has height metres. Its heights at seconds are metres.
Make a prediction. Keep it in mind as you test the representation.
For the specified quadratic, height increases while the rate decreases; finite samples alone do not establish continuous concavity.
Loading the interactive investigation…
Build an answer that explains the mathematics
- 1
Track the outputs
Read the ordered pairs as time and height, in that order. All four heights are different, and each height after the first is larger.
Write the evidenceAs time increases from to seconds, the height increases from to metres.
- 2
Compare equal intervals
The input intervals are all one second long. Compute output change divided by input change on each interval.
Write the evidencemetres per second.
- 3
Connect the two claims
All three average rates are positive, but they get smaller. For this displayed quadratic, that agrees with an increasing, concave-down graph on the given interval.
Write the evidenceThe ball is rising at a decreasing rate. Increasing describes height; decreasing describes the rates of change.
Read one complete model response
Over , the height is increasing. The average rates on successive one-second intervals are , , and metres per second, so the height increases at a decreasing rate; the displayed quadratic is concave down.
Carey teaching response. Use the evidence requested by your actual question; these steps are not additional official scoring points.Spot the exact reasoning error
“The graph is decreasing because the slopes are decreasing.”
The slopes are still positive. Decreasing positive slopes mean the height rises more slowly, not that the height falls. A few table values alone do not prove behavior between every observation unless a function model or other information supports it.
Can you transfer the method?
A tank contains litres at minutes. Describe the observed output change and the successive average rates. Do these four measurements alone prove continuous concavity?
Compare your reasoning
The recorded volumes increase. The average rates are litres per minute, so the sampled rates decrease. The four measurements alone do not establish what happens between them or prove concavity of an unspecified continuous function.
Complete topic reference
Use the guided example above, then connect it to the remaining ideas and representations in this topic.
What You Need to Know
A function pairs each allowed input with one output. Covariation describes how the output responds as the input changes.
Name the input, name the output, state the interval, then describe whether the output increases, decreases, or stays constant.
If time increases from to hours while distance changes from to miles, distance and time vary together. The data show the relationship; they do not by themselves prove a constant rate.
An output value is one snapshot. Increasing or decreasing describes a comparison across ordered inputs.
In a table of time and water depth, which quantity is the input? What sentence describes a depth that falls while time increases?
Learning Objectives
Describe how input and output values vary together by comparing function values.
State the input and output, compare the values in the requested interval, and use precise words such as increasing, decreasing, or constant.
Construct a graph that represents two quantities changing in a contextual situation.
Place the correct starting value, match the direction of change, preserve the domain, and mark any turning or flat interval supported by the context.
Could a graph have the right overall direction but still be wrong? Name one detail that would make it invalid.
Key Concepts
The input produces the output . The domain lists allowed inputs; the range lists the outputs that occur.
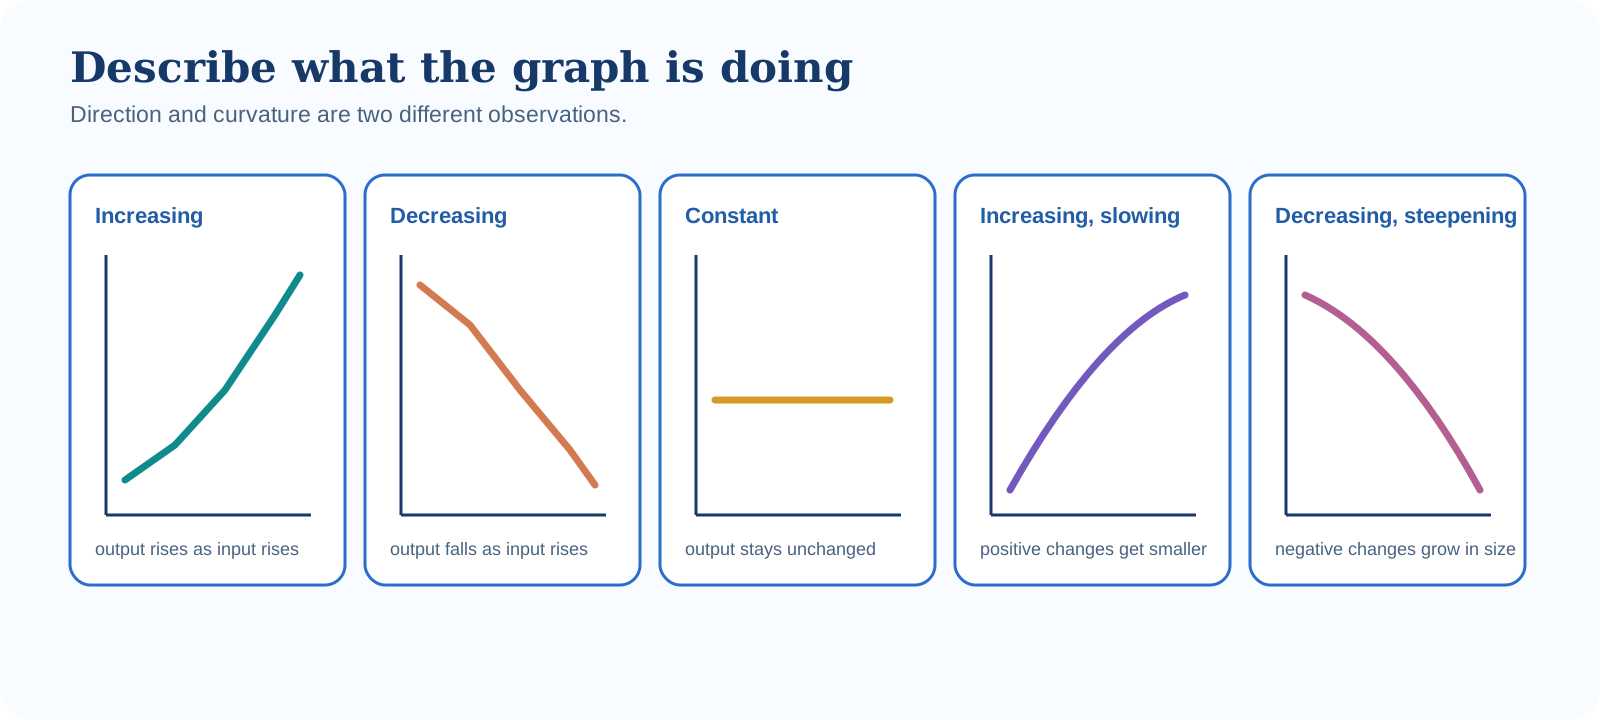
A graph is increasing on an interval when larger inputs give larger outputs. It is decreasing when larger inputs give smaller outputs, and constant when the output does not change.
The image of an input is its output. A preimage is an input that produces a selected output. Keep the direction of the pairing clear.
A function can be increasing while its increases get smaller, or decreasing while its decreases get larger. Direction and changing rate are different observations.
If a graph is flat from to , what happens to the output? Is the function increasing on that interval?
Relevant Representations
Use the representation that exposes the evidence the question asks for: words explain the context, a table pairs values, a graph shows behavior over an interval, and notation names an exact output.
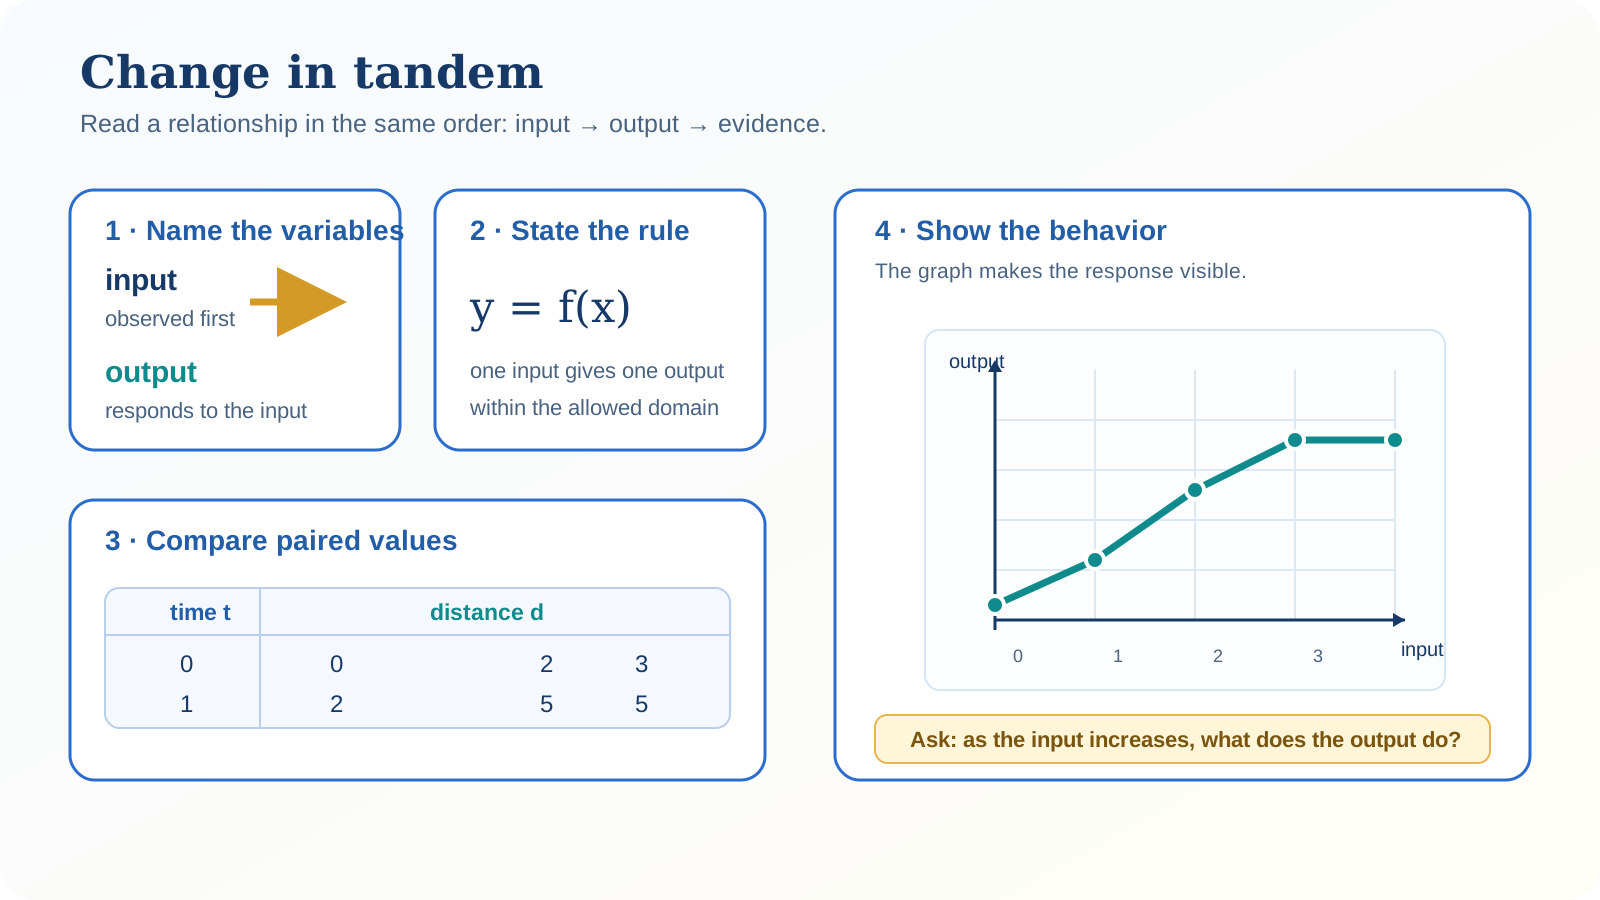
| Representation | Look for | Use it to |
|---|---|---|
| Words | which quantity changes first and what is allowed | identify variables, units, and domain |
| Table | paired values and repeated comparisons | compare function values |
| Graph | direction, flat intervals, turning points, endpoints | describe behavior and build a model |
| Notation | an input-output pairing | evaluate or name an image |
Which representation would you inspect first to find a flat interval: a table, a graph, or an equation? Explain what evidence you would use.
Essential Relationships or Formulas
A change compares two values. An average rate compares the output change with the input change, so the denominator is a change in input, not the second input value.
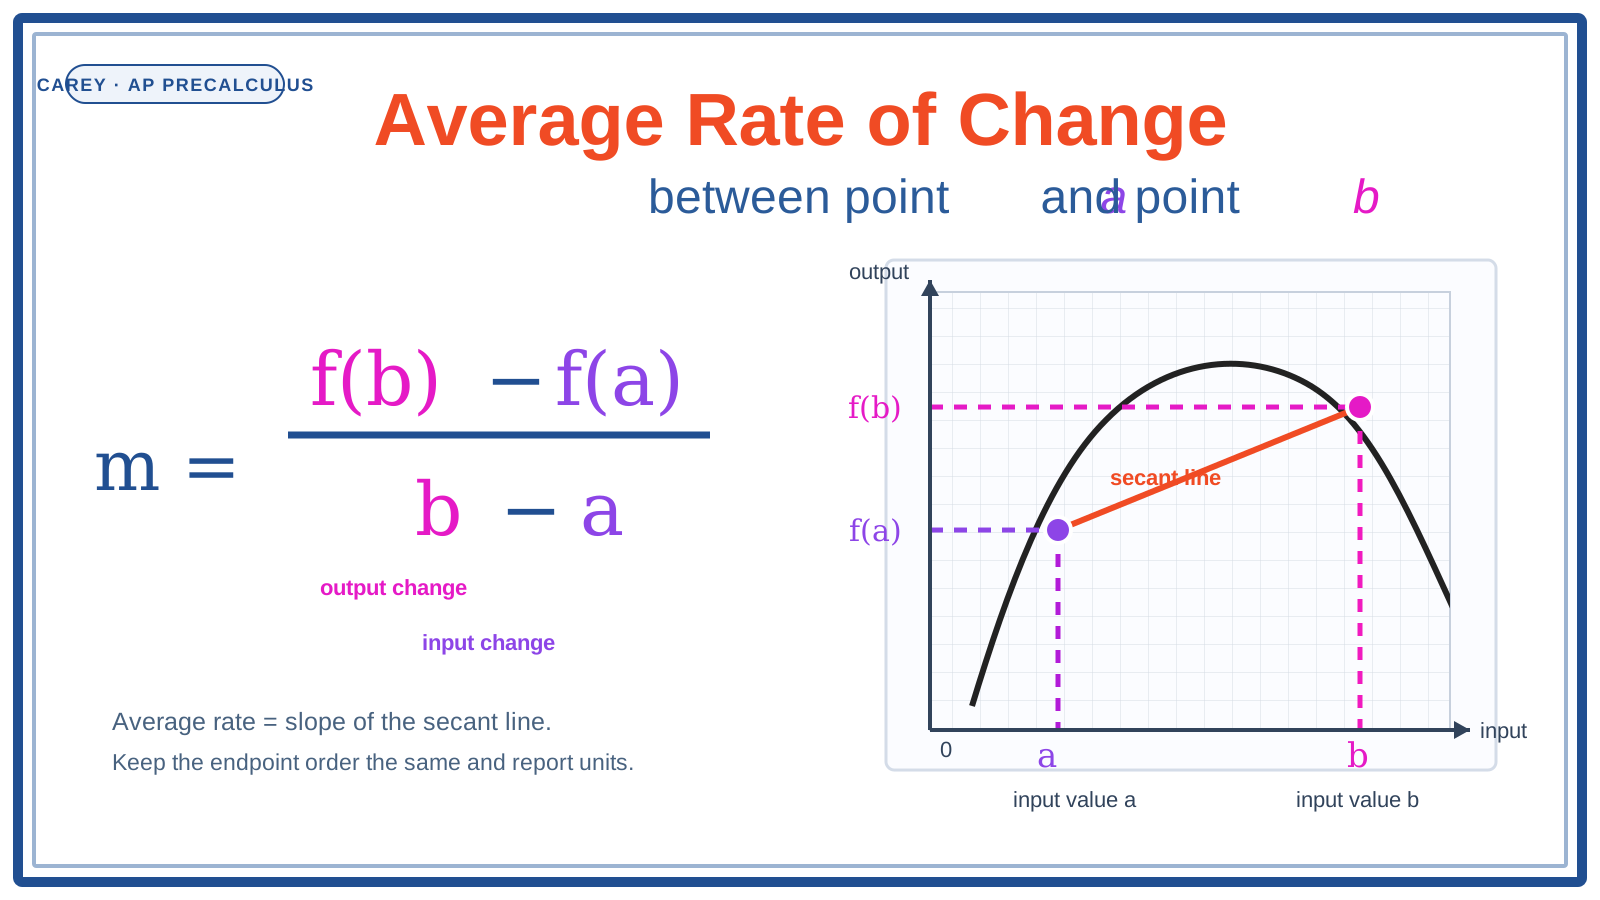
A positive average rate means the output rose over the interval; a negative rate means it fell. Always attach units such as miles per hour or meters per minute.
If and , find the average rate from to . Include the sign and units.
Worked Examples
A runner records distance in miles at hours as , , , .
| (hours) | ||||
|---|---|---|---|---|
| (miles) |
From to , distance increases from to miles. Step — From to , distance is constant at miles. Step — A faithful graph starts at , rises through the first values, and is horizontal from to .
The domain is . Do not extend the line beyond unless the context gives information after the recorded interval.
Common Mistakes
Calling a function increasing because its final value is larger. Check every interval the question names; a graph may rise, flatten, and fall.
Confusing a negative change with a negative output. An output can be positive while its change is negative.
Ignoring the context. A graph with the wrong starting value, endpoint, unit, or domain is not a valid model even if its shape looks reasonable.
Circle the input, underline the output, mark the interval, and decide whether the question asks for a value, change, rate, or graph.
A graph rises overall but has one downward interval. Is it increasing on the entire domain? Explain using intervals.
AP Exam Tips
As the input increases from ___ to ___, the output ___. This forces the interval, direction, and variables into your answer.
Check the starting point, direction on each interval, flat pieces, turning points, endpoint restrictions, and units in that order.
Write the output difference first, write the input difference second, preserve endpoint order, and report the units.
Point to one table entry, graph feature, or function value that proves your choice. “It looks right” is not mathematical evidence.
Use an independent practice question to test what you can now explain.